Category 5...Snowstorm? Regional Snowfall Index Explained
- Tim Dennis
- Feb 26, 2023
- 3 min read
Updated: Feb 4, 2024
Why don't snowstorms have a strength scale like hurricanes and tornadoes? They do, it's just not as well known as the Saffir-Simpson Scale (for tropical cyclones) or the Enhanced Fujita Scale (for tornadoes). The snowstorm scale, like the other two mentioned, categorizes snowstorms into one of five categories, with 5 being the most severe. However, there are a few significant differences with this snowstorm scale.
The Regional Snowfall Index (RSI) is a tool developed by the NOAA to quantify the impacts of snowstorms across the United States. This scale was launched in 2014 and is the second version of a snowstorm scale. The first scale was the Northeast Snowfall Impact Scale (NESIS). As the name suggests, NESIS only focused on storms that impacted the northeast and mid-Atlantic. The RSI expanded upon NESIS and ranks snowstorms in the eastern two thirds of the country.
This RSI takes into account the amount of snowfall, the area affected, and the duration of the event, and assigns a numerical value that reflects the severity of the storm. The RSI differs from Saffir-Simpson and Enhanced Fujita in that the population of the area affected as well as historical precedence are taken into account when assigning a category.
Category | RSI Value | Description |
1 | 1-3 | Notable |
2 | 3-6 | Significant |
3 | 6-10 | Major |
10-18 | Crippling | |
5 | 18+ | Extreme |
Once the snowstorm has passed, NOAA uses a set of criteria to determine the RSI category for the storm. The criteria for storms differs depending on which of the six "climate regions" the storm affected. These regions are the Northern Rockies & Plains, Upper Midwest, South, Ohio Valley, Northeast and Southeast.

Having different criteria for these different regions allows for a standardized method for comparing the impacts of snowstorms across the United States, since different regions will be more affected by snowstorms than others. Areas of the Southeast that see little annual snowfall will be more adversely affected by a moderate snowstorm than the Ohio Valley or Northeast would be from a storm of the same strength.
For example, in 1973, a snowstorm moved through the Southeast, dropping at least 2 inches of snow from Louisiana to Virginia. At least 10 inches fell across large portions of Alabama, Georgia and South Carolina.
This snow fell in areas not prone to snow, with a total of 6.9 million residents seeing at least 10 inches and nobody seeing over 20 inches. This storm received a category 4 ranking. A storm around New Years' 2013-2014 dropped at least 10 inches of snow over 7.4 million residents of the Northeast with nearly 200,000 seeing over 20 inches. This storm received only a category 1 ranking.

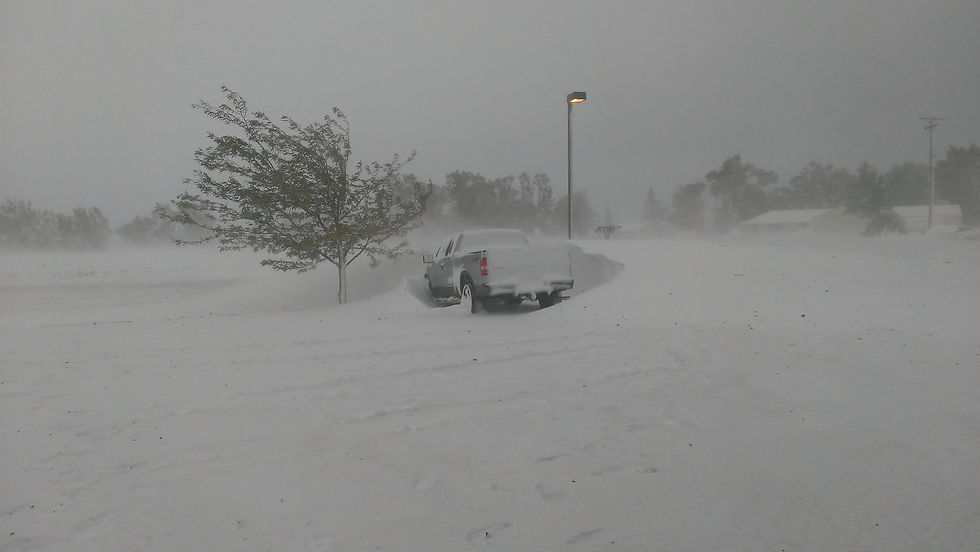
Population plays a big role in determining the storm's ranking. In October of 2013, a storm complex (often called the Cattleman's Blizzard) caused a massive blizzard across South Dakota, Wyoming and Montana. This storm dropped over 5 feet of snow in areas and brought near hurricane force winds.
This storm was ranked at category 3. Despite seeing significantly higher snowfall and much stronger winds than many of the category 4 and 5 storms, this blizzard just did not affect enough people to be ranked higher.

This population-based ranking system is what really sets the RSI apart from the Saffir-Simpson and Enhanced Fujita scales as these scale rank solely based on wind speed. It doesn't matter if a hurricane makes landfall in a major city or remains out to sea, a storm with 160mph winds will always be a category 5.
While the RSI was launched less than a decade ago, over 500 snowstorms dating back to 1900 have been retroactively analysed and given an RSI value and category. Of these 500 storms, only 26 have received a category 5 ranking.
The Northern Rockies and Plains has the most category 5 storms with 7 total, followed by the Northeast, Southeast and Ohio Valley with 5 each. The South and Upper Midwest each have 4 (these numbers add up to over 26 since one storm can strike multiple regions).
For a storm to achieve category 5 strength, the RSI value needs to be at least 18. The highest RSI value for a category 5 is a whopping 39.07. This was the Great Blizzard of 1978 that struck the Ohio Valley (not to be confused with New England's Blizzard of '78, which struck a week later, New England's blizzard of '78 was also a category 5 with an RSI of 18.42).

The highest ranked category 5 for each region goes as follows:
Region | RSI Value | Storm | Date |
Ohio Valley | 39.07 | Great Blizzard of '78 | January 22-27, 1978 |
Northern Rockies and Plains | 34.20 | Unnamed | April 4-10, 1927 |
Northeast | 34.03 | The 100 Hour Storm | February 21-27, 1969 |
South | 31.89 | Unnamed | February 17-21, 1921 |
Upper Midwest | 30.18 | Halloween Blizzard | October 30-November 3, 1991 |
Southeast | 26.37 | Blizzard of 96 | January 5-8, 1996 |


Comments